Every object created by a Java application is allocated by the Java Virtual Machine (JVM), which also determines when that object is no longer needed and reclaims its memory through Garbage Collection (GC).
In this article, we explore how the JVM manages memory, how objects move through different memory regions during their lifetime, and how the Garbage Collector automatically identifies and removes unused objects.
Memory Lifecycle
Every object created in a Java application goes through a well-defined lifecycle.It is first allocated in memory, used by the application, and eventually becomes unreachable when no active references point to it.
At that point, the Garbage Collector can safely reclaim the memory for future allocations.
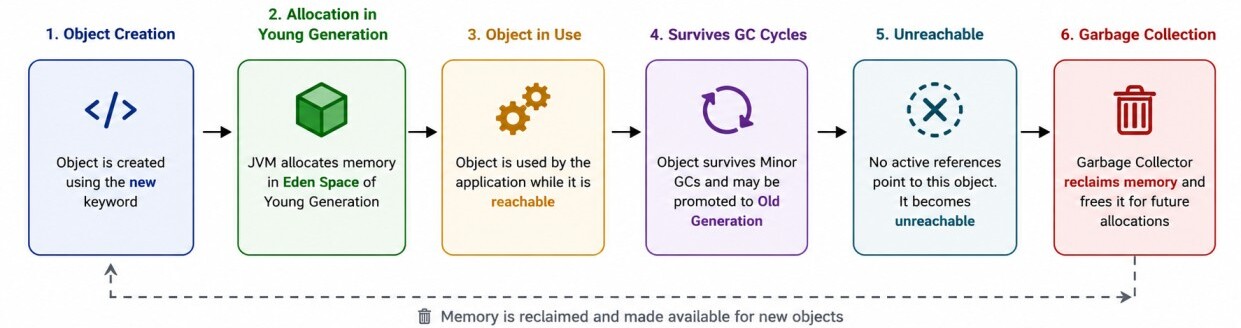
1. An object is created using the
new keyword.2. The JVM allocates memory for the object in the Young Generation (Eden Space).
3. The application uses the object while at least one active reference exists.
4. Objects that survive multiple garbage collection cycles may be promoted to the Old Generation.
5. Once an object is no longer reachable from any GC Root, it becomes eligible for garbage collection.
6. The Garbage Collector eventually reclaims its memory, making that space available for new objects.
This lifecycle is managed entirely by the JVM without requiring developers to explicitly free memory.
Object Allocation
Most objects are created using thenew keyword.
Employee employee = new Employee();
Order order = new Order();
Object Reachability
An object remains alive as long as it can be reached through one or more active references.Employee employee = new Employee();
employee.setName("John"); employee still references the object, the JVM considers it reachable and it cannot be garbage collected.
Eligible for Garbage Collection
When no reachable references point to an object, it becomes eligible for garbage collection.Employee employee = new Employee();
employee = null; null, the object is no longer reachable through that variable. If no other references exist, the object becomes eligible for garbage collection.
Becoming eligible for garbage collection does not mean the object is removed immediately.
The Garbage Collector decides when to reclaim the memory based on the JVM's memory requirements and garbage collection strategy.
Heap Memory Organization
The Heap is the primary memory area used for storing Java objects.To optimize allocation and garbage collection, the JVM divides the heap into multiple regions based on the typical lifetime of objects.
Most newly created objects have a very short lifetime, while a relatively small number remain in memory for much longer.
The JVM takes advantage of this behavior by organizing the heap into separate generations.
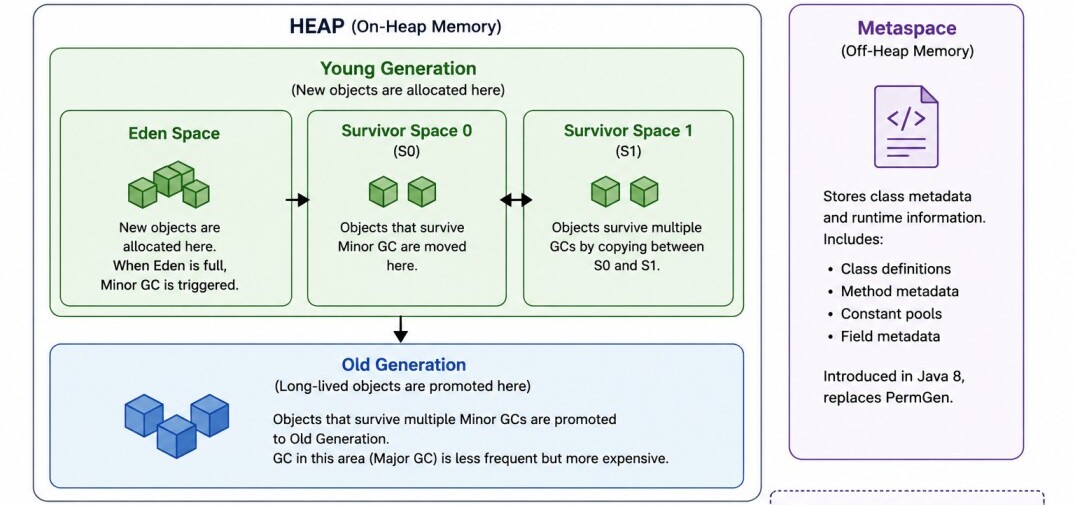
- Young Generation – Stores newly created objects.
- Old Generation – Stores objects that survive multiple garbage collection cycles.
- Metaspace – Stores class metadata and runtime information outside the Java heap.
Young Generation
The Young Generation is where almost all new objects are initially allocated. Since most objects become unreachable shortly after creation, garbage collection occurs frequently in this region and is generally very fast.The Young Generation itself is divided into three regions:
- Eden Space
- Survivor Space 0 (S0)
- Survivor Space 1 (S1)
Eden Space
New objects are normally allocated in the Eden Space.Customer customer = new Customer();
Product product = new Product(); Survivor Spaces (S0 and S1)
Objects that survive a Minor Garbage Collection are copied from Eden into one of the Survivor Spaces.During each subsequent Minor GC, the JVM processes both Eden and the currently active Survivor Space, copying the surviving objects to the other Survivor Space while increasing their age.
Objects that survive multiple Minor Garbage Collection cycles are eventually promoted to the Old Generation.
Object Aging
Every time an object survives a Minor Garbage Collection, its age increases.
The JVM tracks this age internally to determine whether an object should remain in the Young Generation or be promoted to the Old Generation. For example:
- New object → Age 0
- Survives first Minor GC → Age 1
- Survives second Minor GC → Age 2
Continues surviving until the promotion threshold is reached
Old Generation
These objects typically represent long-lived application data, such as cached information, configuration objects, shared services, and large object graphs that remain in use throughout the application's lifetime.Garbage collection in the Old Generation occurs less frequently than in the Young Generation because long-lived objects usually remain reachable for extended periods.
Large Object Allocation
Although most objects are allocated in the Young Generation, very large objects may be allocated directly in the Old Generation.
This avoids repeatedly copying large objects between memory regions during multiple Minor Garbage Collection cycles.
Whether this optimization is used depends on the JVM implementation and the selected garbage collector.
Metaspace
Starting with Java 8, the JVM stores class metadata in Metaspace, which resides in native memory rather than in the Java heap. Metaspace contains information such as:- Class definitions
- Method metadata
- Runtime constant pools
- Field metadata
Unlike application objects, this information is associated with loaded classes rather than instances created using the
new keyword.
Minor, Major and Full Garbage Collection
The JVM does not scan the entire heap every time memory needs to be reclaimed. Instead, it performs different types of garbage collection depending on which memory regions require cleanup.Minor Garbage Collection
A Minor GC occurs when the Young Generation becomes full. Only the Young Generation is processed during this collection.Since the Young Generation is relatively small and most objects die young, Minor GCs are usually completed very quickly.
Major Garbage Collection
A Major GC focuses primarily on the Old Generation.Because the Old Generation contains long-lived objects, garbage collection typically requires more work and therefore takes longer than a Minor GC.
Major GCs occur much less frequently because long-lived objects generally remain reachable for extended periods.
Full Garbage Collection
A Full GC performs garbage collection across the entire heap and may also reclaim class metadata from Metaspace when necessary.Since the JVM examines a much larger memory region, Full GCs usually have the greatest impact on application performance.
Modern JVMs attempt to minimize Full GC events because they are significantly more expensive than Minor GCs.
Stop-The-World (STW)
During many garbage collection operations, the JVM temporarily pauses application threads so that memory can be examined safely. This pause is known as a Stop-The-World (STW) event.While the application is paused, the Garbage Collector identifies reachable objects, reclaims unused memory, and updates object references when necessary.
Modern garbage collectors are designed to keep these pauses as short as possible, particularly for applications requiring low latency.
| Garbage Collection | Memory Area | Frequency | Performance Impact |
|---|---|---|---|
| Minor GC | Young Generation | Frequent | Usually Fast |
| Major GC | Old Generation | Less Frequent | Slower |
| Full GC | Entire Heap + Metaspace (when required) | Rare | Slowest |
Garbage Collection Process
The JVM performs a series of steps to ensure that only unreachable objects are removed while preserving all objects that are still required by the application.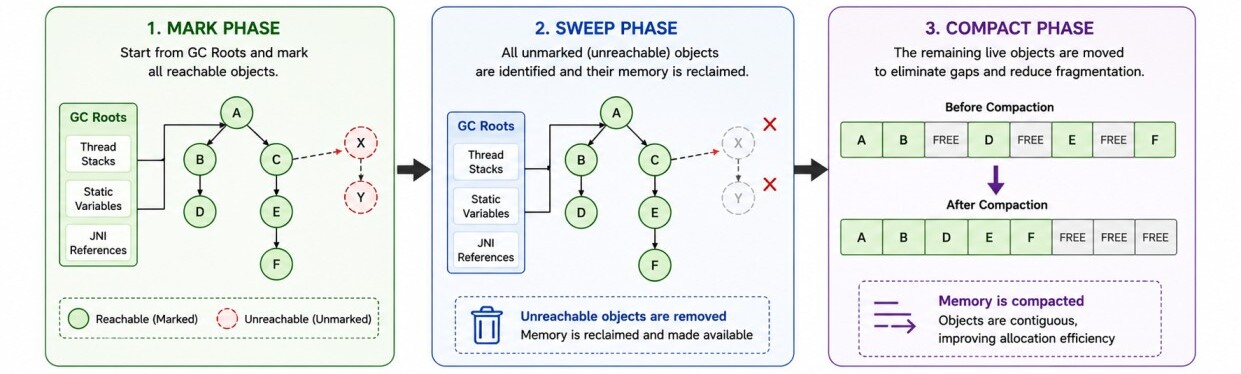
1. Mark
2. Sweep
3. Compact
1. Mark Phase
During the Mark phase, the JVM starts from a set of known live references called GC Roots and traverses the object graph.Every object that can be reached directly or indirectly from a GC Root is marked as reachable. Objects that cannot be reached remain unmarked and become candidates for garbage collection.
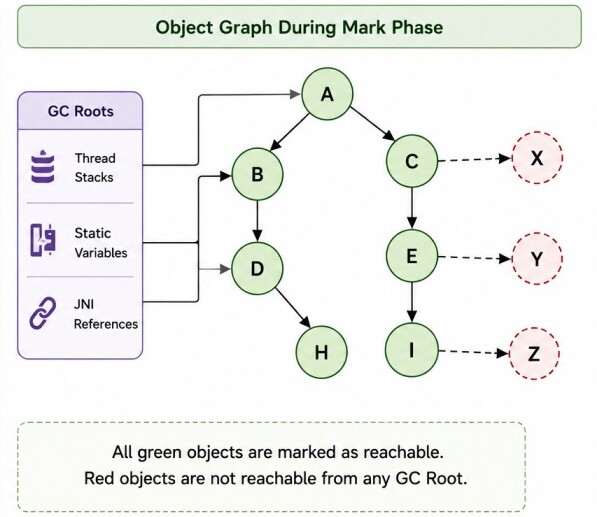
GC Root → Employee → Department → Manager2. Sweep Phase
After identifying all reachable objects, the JVM enters the Sweep phase.During this phase, every unmarked object is considered garbage, and the memory occupied by those objects is reclaimed.
Reachable Objects: ✔ Employee ✔ Department ✔ Manager
Unreachable Objects: ✘ Order ✘ Customer ✘ Product 3. Compact Phase
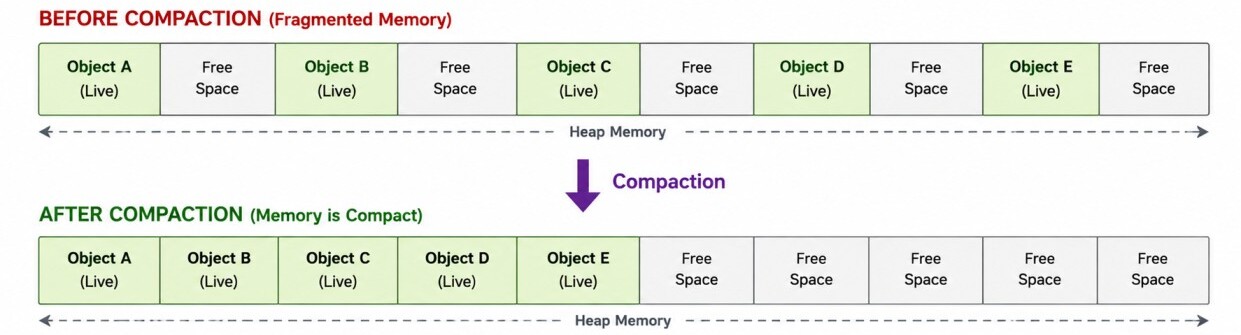
Repeated allocation and garbage collection can leave small gaps scattered throughout the heap.This condition is known as memory fragmentation. Although the total amount of free memory may be sufficient, it can be divided into many small regions that make large object allocation inefficient.
During the Compact phase, the JVM moves the remaining live objects closer together, eliminating fragmented free space.
Do All Garbage Collectors Follow This Process?
The Mark → Sweep → Compact model provides a simple way to understand garbage collection, but modern JVM garbage collectors often use more sophisticated techniques.
For example, some collectors copy live objects instead of sweeping memory, while others perform parts of the collection concurrently with application threads to reduce pause times.
Regardless of the implementation, every garbage collector must ultimately:
- Identify reachable objects.
- Reclaim memory occupied by unreachable objects.
- Keep the heap in a state that allows efficient future allocations.
Circular References
Two objects referencing each other cannot cause a memory leak.class Employee {
Department department;
}
class Department {
Employee manager;
}
Employee ─────► Department
▲ │
└──────────────┘
(No path from any GC Root)
This is one of the major advantages of modern tracing garbage collectors over simple reference-counting techniques, which cannot reclaim circular references.
GC Roots
The Garbage Collector begins its search for reachable objects from a set of well-known references called GC Roots. These references are always considered alive by the JVM.Starting from each GC Root, the JVM traverses every connected object.
Any object that can be reached through one or more paths remains alive. Objects that cannot be reached from any GC Root become eligible for garbage collection.
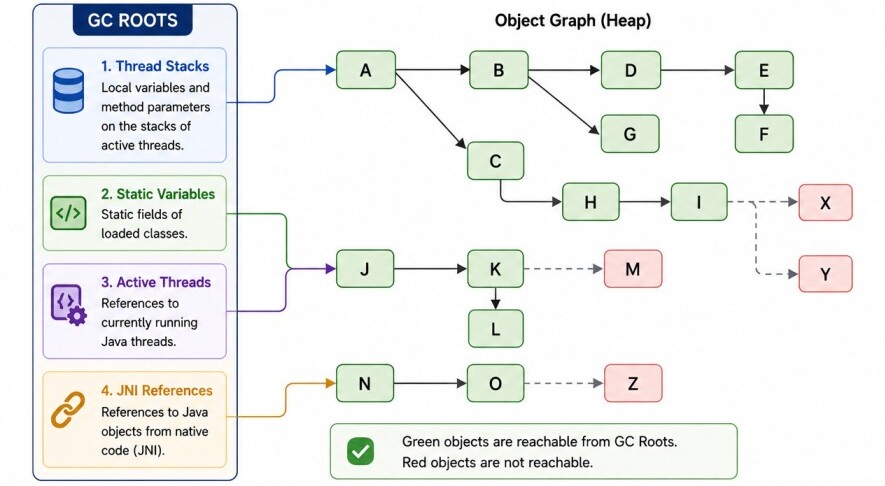
- References stored in thread stacks (local variables)
- Static variables of loaded classes
- Active Java threads
- JNI (Java Native Interface) references used by native code
Local Variables
Objects referenced by local variables inside an executing method are considered reachable.public void process() {
Employee employee = new Employee();
employee.setName("John");
}
process() method is executing, the employee variable resides on the thread's stack and acts as a GC Root.
Once the method completes, the local variable goes out of scope. If no other references to the object exist, it becomes eligible for garbage collection.
Static Variables
Objects referenced by static variables remain reachable for as long as the class is loaded.public class Cache {
private static final Map DATA = new HashMap<>();
}
DATA remains reachable until the entries are removed or the class is unloaded.
Active Threads
Every running Java thread is treated as a GC Root. Objects referenced by a thread's execution stack remain alive while the thread is active.Thread thread = new Thread(() -> {
Employee employee = new Employee();
System.out.println(employee);
});
thread.start();
employee object cannot be garbage collected while the thread is executing because it is referenced from the thread's stack.
JNI References
Applications sometimes interact with native libraries written in languages such as C or C++ through the Java Native Interface (JNI).Objects referenced by native code are also treated as reachable until those native references are released.
Reference Types
By default, every object reference in Java is a Strong Reference.However, the Java platform also provides Soft, Weak, and Phantom references, allowing applications to control how objects participate in garbage collection.
These specialized reference types are commonly used in caching frameworks, memory-sensitive applications, and resource cleanup mechanisms.
| Reference Type | Collected During GC | Typical Use Case |
|---|---|---|
| Strong | No | Normal object references |
| Soft | When memory is low | Memory-sensitive caches |
| Weak | At the next GC | WeakHashMap, canonical mappings |
| Phantom | After finalization, before memory reclamation | Resource cleanup and cleanup notifications |
Strong References
A normal Java reference is a Strong Reference.Employee employee = new Employee(); Soft References
You wrap an object usingjava.lang.ref.SoftReference. The JVM keeps the object alive until it risks throwing an OutOfMemoryError.
SoftReference reference =
        new SoftReference<>(new Employee());
Employee employee = reference.get(); // Returns null if GC reclaimed it
get() returns null.
Weak References
Objects referenced only through Weak References are eligible for garbage collection during the next GC cycle.Created using
java.lang.ref.WeakReference. The moment the active strong references disappear, the GC will aggressively wipe this object out on its next run.
WeakReference reference =
        new WeakReference<>(new Employee());
Employee employee = reference.get();
WeakHashMap, allowing entries to disappear automatically when their keys are no longer strongly referenced elsewhere.
Phantom References
A Phantom Reference does not provide access to the referenced object.Instead, it allows applications to receive notification after the object becomes unreachable and just before its memory is reclaimed.
Created using
java.lang.ref.PhantomReference. Unlike Soft or Weak references, calling .get() on a phantom reference always returns null.
ReferenceQueue queue = new ReferenceQueue<>();
PhantomReference reference =
        new PhantomReference<>(
                new Employee(),
                queue
        );
finalize() and Cleaner API
Earlier versions of Java provided thefinalize() method, allowing an object to execute cleanup logic before being reclaimed by the Garbage Collector.
class Employee {
    @Override
    protected void finalize() throws Throwable {
        System.out.println("Cleaning up");
    }
}
finalize() has several significant drawbacks. There is no guarantee that it will be executed, or when it will run.
It introduces additional overhead for the Garbage Collector, can delay memory reclamation, and has been deprecated for removal in modern Java versions.
Instead of relying on
finalize(), modern Java applications should use the Cleaner API when cleanup actions are required after an object becomes unreachable.
For resources such as files, sockets, and database connections, the preferred approach is to implement
AutoCloseable and use try-with-resources, ensuring deterministic resource cleanup rather than waiting for the Garbage Collector.
class DatabaseConnection implements AutoCloseable {
    public void query() {
        System.out.println("Executing query...");
    }
    @Override
    public void close() {
        System.out.println("Connection closed.");
    }
}

public class Main {
    public static void main(String[] args) {
        try (DatabaseConnection connection = new DatabaseConnection()) {
            connection.query();
        }
    }
}
Common Memory Problems
Although Java automatically manages memory, applications can still encounter memory-related problems due to poor coding practices, excessive object creation, or insufficient memory configuration.Some of the most common memory issues include:
- Memory Leaks
- OutOfMemoryError
- StackOverflowError
Memory Leak
A Memory Leak occurs when objects are no longer needed by the application but remain reachable because references to them are unintentionally retained. For example:List cache = new ArrayList<>();
public void addEmployee(Employee employee) {
cache.add(employee);
}
Unlike languages with manual memory management, memory leaks in Java are generally caused by unintentional object references rather than forgetting to free memory.
OutOfMemoryError
AnOutOfMemoryError occurs when the JVM cannot allocate additional memory for an object. This usually indicates either insufficient memory or excessive memory consumption by the application.
Some common variants include:
1. Java Heap Space: The heap has insufficient space to allocate new objects.
Exception in thread "main" java.lang.OutOfMemoryError: Java heap space 2. Metaspace: The JVM cannot allocate additional memory for class metadata.
java.lang.OutOfMemoryError: Metaspace 3. GC Overhead Limit Exceeded: The Garbage Collector spends most of its time attempting to reclaim memory but recovers very little.
java.lang.OutOfMemoryError: GC overhead limit exceeded StackOverflowError
Each Java thread has its own stack for storing method calls and local variables.A
StackOverflowError occurs when the call stack becomes full, most commonly because of infinite or excessively deep recursion.
public void print() {
    print();
}
Exception in thread "main" java.lang.StackOverflowError StackOverflowError is caused by exhausting a thread's stack memory rather than the heap.
Monitoring Memory
The JDK provides several tools for monitoring memory usage, analyzing heap contents, and diagnosing memory-related problems.| Tool | Purpose |
|---|---|
jps |
Lists running Java processes. |
jstat |
Displays JVM and garbage collection statistics. |
jmap |
Generates heap dumps and memory information. |
jcmd |
Executes diagnostic commands against a running JVM. |
jstack |
Captures thread stack traces. |
VisualVM |
Provides a graphical interface for monitoring JVM performance. |
JConsole |
Monitors memory, threads, classes, and MBeans. |
jps
Thejps command lists all running Java processes.
jps jstat
Thejstat command displays garbage collection and memory statistics for a running JVM.
jstat -gc <pid> jmap
Thejmap command can generate a heap dump for further analysis.
jmap -dump:live,file=heap.hprof <pid> jcmd
Thejcmd utility provides a wide range of diagnostic commands.
jcmd <pid> GC.heap_info jstack
Thejstack command captures thread stack traces from a running JVM.
jstack <pid> VisualVM and JConsole
VisualVM and JConsole provide graphical tools for monitoring JVM behavior.They allow developers to observe heap usage, garbage collection activity, thread execution, CPU utilization, loaded classes, and memory consumption over time.
These tools make it easier to identify abnormal memory growth, frequent garbage collection, and other performance issues without relying solely on command-line utilities.
Final Notes
Java's automatic memory management is one of the platform's greatest strengths.By allocating objects on the heap, tracking their reachability, and reclaiming unused memory through the Garbage Collector, the JVM allows developers to focus on application logic rather than manual memory management.
In the next article, we will explore the various Garbage Collector implementations, including Serial GC, Parallel GC, G1 GC, ZGC, and Shenandoah GC, along with their architectures, advantages, and ideal use cases.