A Java application inside a container is throwing java.lang.OutOfMemoryError: Java heap space, but the server still has plenty of free RAM. Where would you start investigating?A Java application running inside a Docker container or inside a Kubernetes Pod can unexpectedly throw an OutOfMemoryError, even though the underlying server or Kubernetes node still has several gigabytes of free memory.
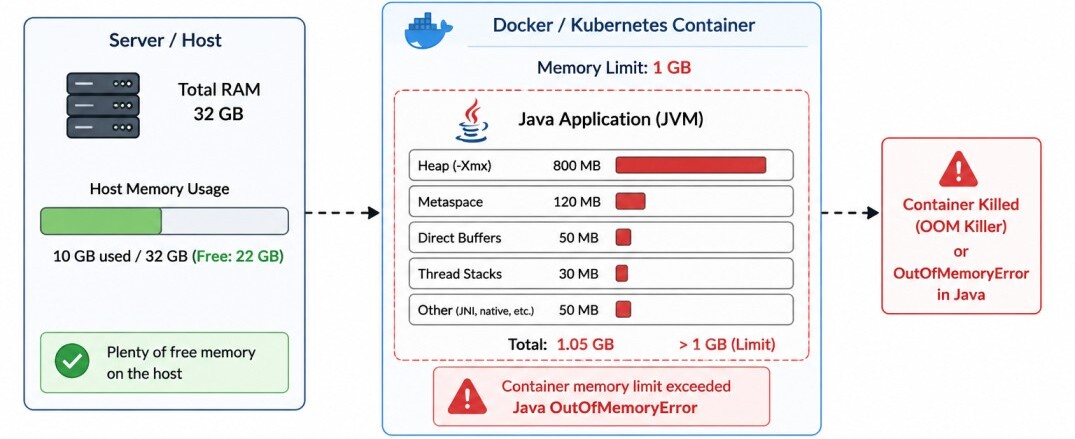
While that may solve the problem in some cases, we should know that an OutOfMemoryError is usually a symptom, not necessarily the root cause.
The exception simply tells us that the JVM was unable to allocate another object on the Java heap. It does not explain why the heap became exhausted.
The heap may genuinely be too small for the application's workload, but it could also indicate a memory leak, an unexpected increase in object allocation, or objects being retained much longer than expected.
Containerised environments introduce another important consideration. The memory available to the host operating system and the memory available to a container are not necessarily the same.
A Docker container or a Kubernetes Pod can have its own memory limit that is significantly lower than the amount of RAM available on the underlying machine.
Furthermore, the JVM uses memory for much more than just the Java Heap. Metaspace, Thread Stacks, Direct Buffers, the JIT Code Cache, and other native allocations all contribute to the total memory footprint of the Java process.
In this article, we'll discuss how to investigate OutOfMemoryError issues in a production environment.
Step 1. Verify the Container Memory Limit
Whether the application is running inside a Docker container or inside a container managed by Kubernetes, the JVM can never use more memory than the container is allowed to consume.For applications running in Docker, the configured memory limit can be viewed using the following command.
docker inspect -f '{{.HostConfig.Memory}}' <container>docker inspect -f '{{.HostConfig.Memory}}' a5b133a4cdee536870912 You can also monitor the container's current memory usage in real time.
docker stats <container>docker stats a5b133a4cdeeCONTAINER ID NAME CPU % MEM USAGE / LIMIT MEM % NET I/O BLOCK I/O PIDS
a5b133a4cdee k8s_backendml_backendml-7cd79d668-p5bf5_default_220dac0e-0d1e-4a7e-ba10-216cbd1f9b92_0 0.10% 207.9MiB / 512MiB 40.61% 0B / 0B 0B / 123kB 29For applications deployed on Kubernetes, start by describing the Pod.
kubectl describe pod <pod-name>Limits:
memory: 512Mi
Requests:
memory: 256Mi
Kubernetes does not define memory directly for a Pod. Instead, memory requests and limits are configured for each container.Once the process exceeds this limit, Kubernetes may terminate the container regardless of how much memory remains available on the host.
A Pod's total memory usage is the combined memory consumed by all of its containers.
Since our Pod contains only a single Spring Boot container, the container's memory usage is effectively the same as the Pod's memory usage.
Now that we know how much memory is available to the container, the next step is to determine how much of that memory has been allocated to the Java heap.
Step 2. Verify the JVM Heap Configuration
Let's start by checking the JVM startup arguments.app# jcmd <PID> VM.command_lineTo get PID, open a shell inside the container/pod and Find the Java PID.For our Spring Boot application, the JVM is running as process 1, so we execute:docker exec -itbash kubectl exec -it-- bash kubectl exec -it backendml-7c7c58464f-vdc72 -- bash app# ps -ef UID PID PPID C STIME TTY TIME CMD root 1 0 0 07:04 ? 00:00:08 java -jar app.jar root 41 0 0 07:58 pts/0 00:00:00 bash root 48 41 66 07:59 pts/0 00:00:00 ps -ef
app# jcmd 1 VM.command_line.
.
.
1:
VM Arguments:
jvm_args: -Xms128m -Xmx256m -XX:+HeapDumpOnOutOfMemoryError -XX:+UseG1GC -XX:HeapDumpPath=/tmp -XX:NativeMemoryTracking=summary -Xlog:gc*:file=/tmp/gc.log:time,uptime,level,tags
java_command: app.jar
java_class_path (initial): app.jar
Launcher Type: SUN_STANDARD
The important values here are:
-Xms128m — The JVM starts with an initial heap size of 128 MB.
-Xmx256m — The Java heap can grow to a maximum of 256 MB.
Earlier, we discovered that the container itself has a memory limit of 512 MiB. This means that only half of the container's available memory has been allocated to the Java heap.
The remaining memory is reserved for other JVM components such as Metaspace, Thread Stacks, Direct Buffers, the JIT Code Cache, and various native allocations.
Next, inspect the current heap usage.
app# jcmd 1 GC.heap_info1:
garbage-first heap total reserved 262144K, committed 131072K, used 74614K
region size 1024K, 70 young (71680K), 7 survivors (7168K)
Reserved Heap (262144K) is the maximum heap size the JVM is allowed to use, as configured by -Xmx256m. This memory is reserved exclusively for the Java heap, although not all of it has necessarily been allocated from the operating system.
Committed Heap (131072K) is the portion of the reserved heap that the JVM has currently allocated from the operating system. The JVM can immediately use this memory for object allocation without requesting additional memory from the operating system.
Used Heap (74614K) is the portion of the committed heap currently occupied by live Java objects. The remaining committed heap is free space that the JVM can use for new object allocations.
The second line shows that G1 has divided the heap into fixed-size 1 MB regions.
Unlike older collectors that divide memory into fixed Young and Old generations, G1 manages the heap as a collection of equally sized regions and dynamically assigns each region a role.
At the moment, the JVM is using 70 Young Regions, where newly created objects are allocated, and 7 Survivor Regions, which temporarily hold objects that have survived one or more garbage collection cycles.
Objects that continue to remain reachable are eventually promoted into the Old Generation.
These numbers tell us that the JVM is operating normally. The heap is well below its configured maximum of 256 MB, and there is no immediate indication that the heap itself has been exhausted.
Modern JVMs are container-aware, meaning they automatically detect the CPU and memory limits imposed by the container runtime instead of assuming they can use all the resources available on the host machine.
You can verify this using the following command.
app# java -XshowSettings:system -versionOperating System Metrics:
Provider: cgroupv2
Effective CPU Count: 8
CPU Period: 100000us
CPU Quota: -1
CPU Shares: 2us
List of Processors: N/A
List of Effective Processors, 8 total:
0 1 2 3 4 5 6 7
List of Memory Nodes: N/A
List of Available Memory Nodes, 1 total:
0
Memory Limit: 512.00M
Memory Soft Limit: 0.00K
Memory & Swap Limit: 512.00M
Maximum Processes Limit: Unlimited
openjdk version "25.0.3" 2026-04-21 LTS
OpenJDK Runtime Environment Temurin-25.0.3+9 (build 25.0.3+9-LTS)
OpenJDK 64-Bit Server VM Temurin-25.0.3+9 (build 25.0.3+9-LTS, mixed mode, sharing)
More importantly, it reports a Memory Limit of 512 MB, which exactly matches the memory limit configured for our Kubernetes container.
If the JVM were not container-aware, it could incorrectly assume that all of the host's memory was available and size the heap accordingly.
At this stage, we have confirmed three important facts. The container has a memory limit of 512 MiB, the JVM has been configured with a maximum heap size of 256 MB, and the JVM has correctly detected the container's resource limits.
The next step is to compare the Java heap with the total memory consumed by the Java process.
Step 3. Compare Heap Memory with Overall Process Memory
The JVM allocates memory for much more than just application objects.Additional memory is consumed by Metaspace, Thread Stacks, Direct Buffers, the JIT Code Cache, JNI Allocations, the garbage collector itself, and various internal JVM data structures.
These allocations exist outside the Java heap but still contribute to the process's overall memory footprint.
Let's begin by examining the operating system's view of the Java process.
app# ps -o pid,rss,vsz,comm -p 1 PID RSS VSZ COMMAND
1 315208 4710876 java
RSS (Resident Set Size) — The amount of physical memory currently occupied by the Java process.
VSZ (Virtual Size) — The total virtual address space reserved by the process.
Notice that the JVM's RSS (≈ 308 MB) is larger than the live heap usage reported by GC.heap_info (≈ 74 MB). This is expected because the RSS includes the Java heap as well as every native memory allocation made by the JVM.
To understand exactly where this memory is being consumed, inspect the JVM's native memory breakdown.
app# jcmd 1 VM.native_memory summary.
.
.
1:
Native Memory Tracking:
(Omitting categories weighting less than 1KB)
Total: reserved=1799370KB, committed=258398KB
malloc: 33438KB #135438, peak=65159KB #119784
mmap: reserved=1765932KB, committed=224960KB
- Java Heap (reserved=262144KB, committed=131072KB)
(mmap: reserved=262144KB, committed=131072KB, peak=133120KB)
- Class (reserved=1049117KB, committed=4573KB)
(classes #7448)
( instance classes #6887, array classes #561)
(malloc=541KB tag=Class #13564) (at peak)
(mmap: reserved=1048576KB, committed=4032KB, at peak)
( Metadata: )
( reserved=65536KB, committed=25472KB)
( used=25245KB)
( waste=227KB =0.89%)
( Class space:)
( reserved=1048576KB, committed=4032KB)
( used=3823KB)
( waste=209KB =5.18%)
- Thread (reserved=85822KB, committed=3098KB)
(threads #42)
(stack: reserved=85680KB, committed=2956KB, peak=2956KB)
(malloc=95KB tag=Thread #254) (peak=103KB #258)
(arena=47KB #80) (peak=316KB #48)
- Code (reserved=254345KB, committed=16697KB)
(malloc=4732KB tag=Code #19867) (at peak)
(mmap: reserved=249612KB, committed=11964KB, at peak)
(arena=1KB #1) (peak=35KB #3)
- GC (reserved=54873KB, committed=52321KB)
(malloc=16917KB tag=GC #4056) (peak=16928KB #3890)
(mmap: reserved=37956KB, committed=35404KB, peak=35436KB)
(arena=0KB #0) (peak=4KB #4)
- GCCardSet (reserved=7KB, committed=7KB)
(malloc=7KB tag=GCCardSet #23) (peak=8KB #24)
- Compiler (reserved=217KB, committed=217KB)
(malloc=21KB tag=Compiler #84) (peak=32KB #97)
(arena=196KB #6) (peak=35643KB #22)
- Internal (reserved=1366KB, committed=1366KB)
(malloc=1330KB tag=Internal #5877) (at peak)
(mmap: reserved=36KB, committed=36KB, at peak)
- Other (reserved=26KB, committed=26KB)
(malloc=26KB tag=Other #2) (peak=36KB #4)
- Symbol (reserved=6190KB, committed=6190KB)
(malloc=5414KB tag=Symbol #83948) (at peak)
(arena=775KB #1) (at peak)
- Native Memory Tracking (reserved=2425KB, committed=2425KB)
(malloc=44KB tag=Native Memory Tracking #771) (peak=44KB #772)
(tracking overhead=2381KB)
- Shared class space (reserved=16384KB, committed=14016KB, readonly=0KB)
(mmap: reserved=16384KB, committed=14016KB, peak=14272KB)
- Arena Chunk (reserved=163KB, committed=163KB)
(malloc=163KB tag=Arena Chunk #112) (peak=39363KB #971)
- Tracing (reserved=11KB, committed=11KB)
(malloc=11KB tag=Tracing #51) (at peak)
- Logging (reserved=0KB, committed=0KB)
(malloc=0KB tag=Logging) (peak=1KB #1)
- Module (reserved=72KB, committed=72KB)
(malloc=72KB tag=Module #1958) (at peak)
- Safepoint (reserved=8KB, committed=8KB)
(mmap: reserved=8KB, committed=8KB, at peak)
- Synchronization (reserved=524KB, committed=524KB)
(malloc=524KB tag=Synchronization #4782) (at peak)
- Serviceability (reserved=17KB, committed=17KB)
(malloc=17KB tag=Serviceability #14) (peak=20KB #18)
- Metaspace (reserved=65658KB, committed=25594KB)
(malloc=122KB tag=Metaspace #56) (at peak)
(mmap: reserved=65536KB, committed=25472KB, at peak)
- String Deduplication (reserved=1KB, committed=1KB)
(malloc=1KB tag=String Deduplication #8) (at peak)
- Object Monitors (reserved=1KB, committed=1KB)
(malloc=1KB tag=Object Monitors #3) (peak=14KB #72)
Metaspace stores class metadata, including information about loaded classes, methods, and fields.
Thread represents the native memory allocated for thread stacks, with each Java thread having its own dedicated stack.
Code contains the native machine code generated by the Just-In-Time (JIT) compiler to improve application performance.
GC represents the memory used internally by the garbage collector for managing memory allocation and reclamation.
Internal includes various JVM internal data structures, runtime allocations, and other native memory used by the JVM.
A Java process can consume hundreds of megabytes outside the heap through thread stacks, direct buffers, Metaspace, and other native allocations.
Step 4. Capture and Analyse a Heap Dump
The most reliable way to answer which objects are occupying the heap and why they haven't been garbage collected is by analysing a heap dump.A heap dump is a snapshot of every object currently stored on the Java heap, including the relationships between those objects.
If the application is still running, a heap dump can be captured using jcmd.
jcmd <PID> GC.heap_dump heap.hprofjmap -dump:live,format=b,file=heap.hprof <PID>-XX:+HeapDumpOnOutOfMemoryError
-XX:HeapDumpPath=/tmpTo analyze a heap dump generated inside a Docker container, you need to follow a two-step workflow:
First, copy the heap dump from the container to your local machine. For Kubernetes, use kubectl cp to download the file from the /tmp directory:
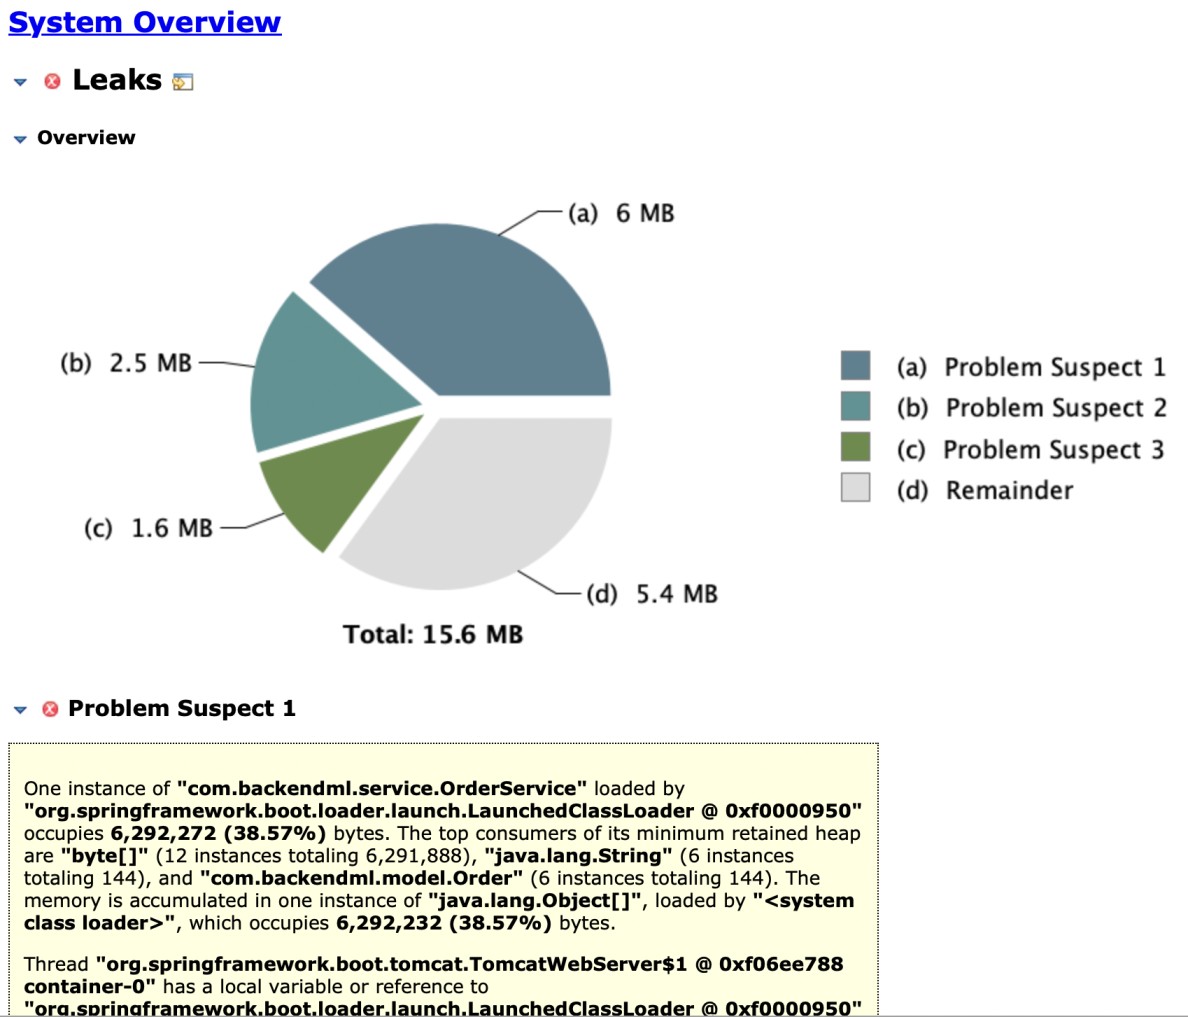
kubectl cp /:/tmp/.hprof ./heapdump.hprof 1. Eclipse Memory Analyzer (MAT) is the most popular tool for analyzing Java heap dumps. One of the first reports to examine in Eclipse MAT is the Leak Suspects Report.
This report automatically highlights objects retaining unusually large amounts of memory and provides an excellent starting point for investigating potential memory leaks.
Unlike a simple list of large objects, the Dominator Tree shows which objects are preventing other objects from being garbage collected.
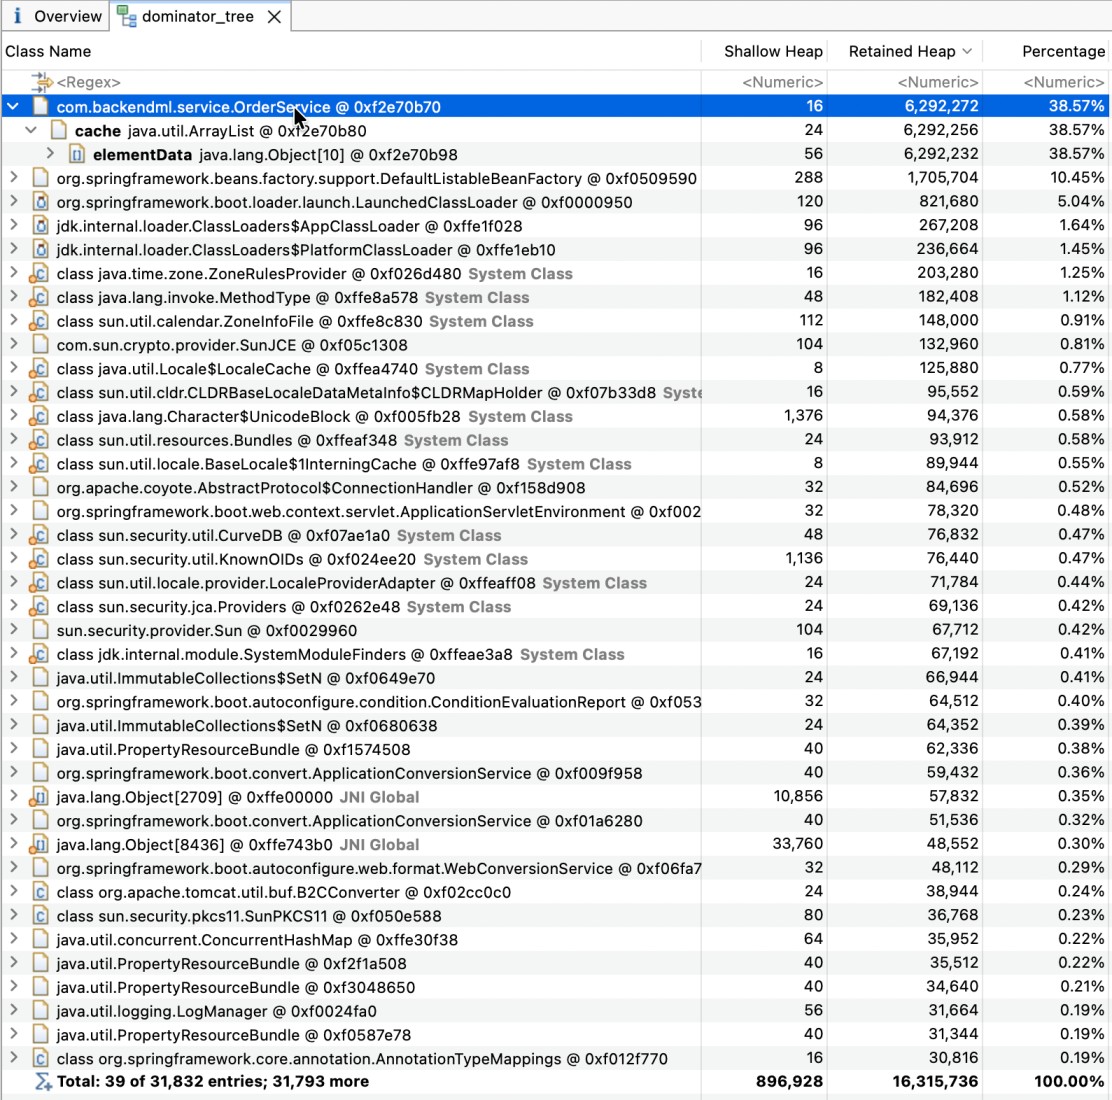
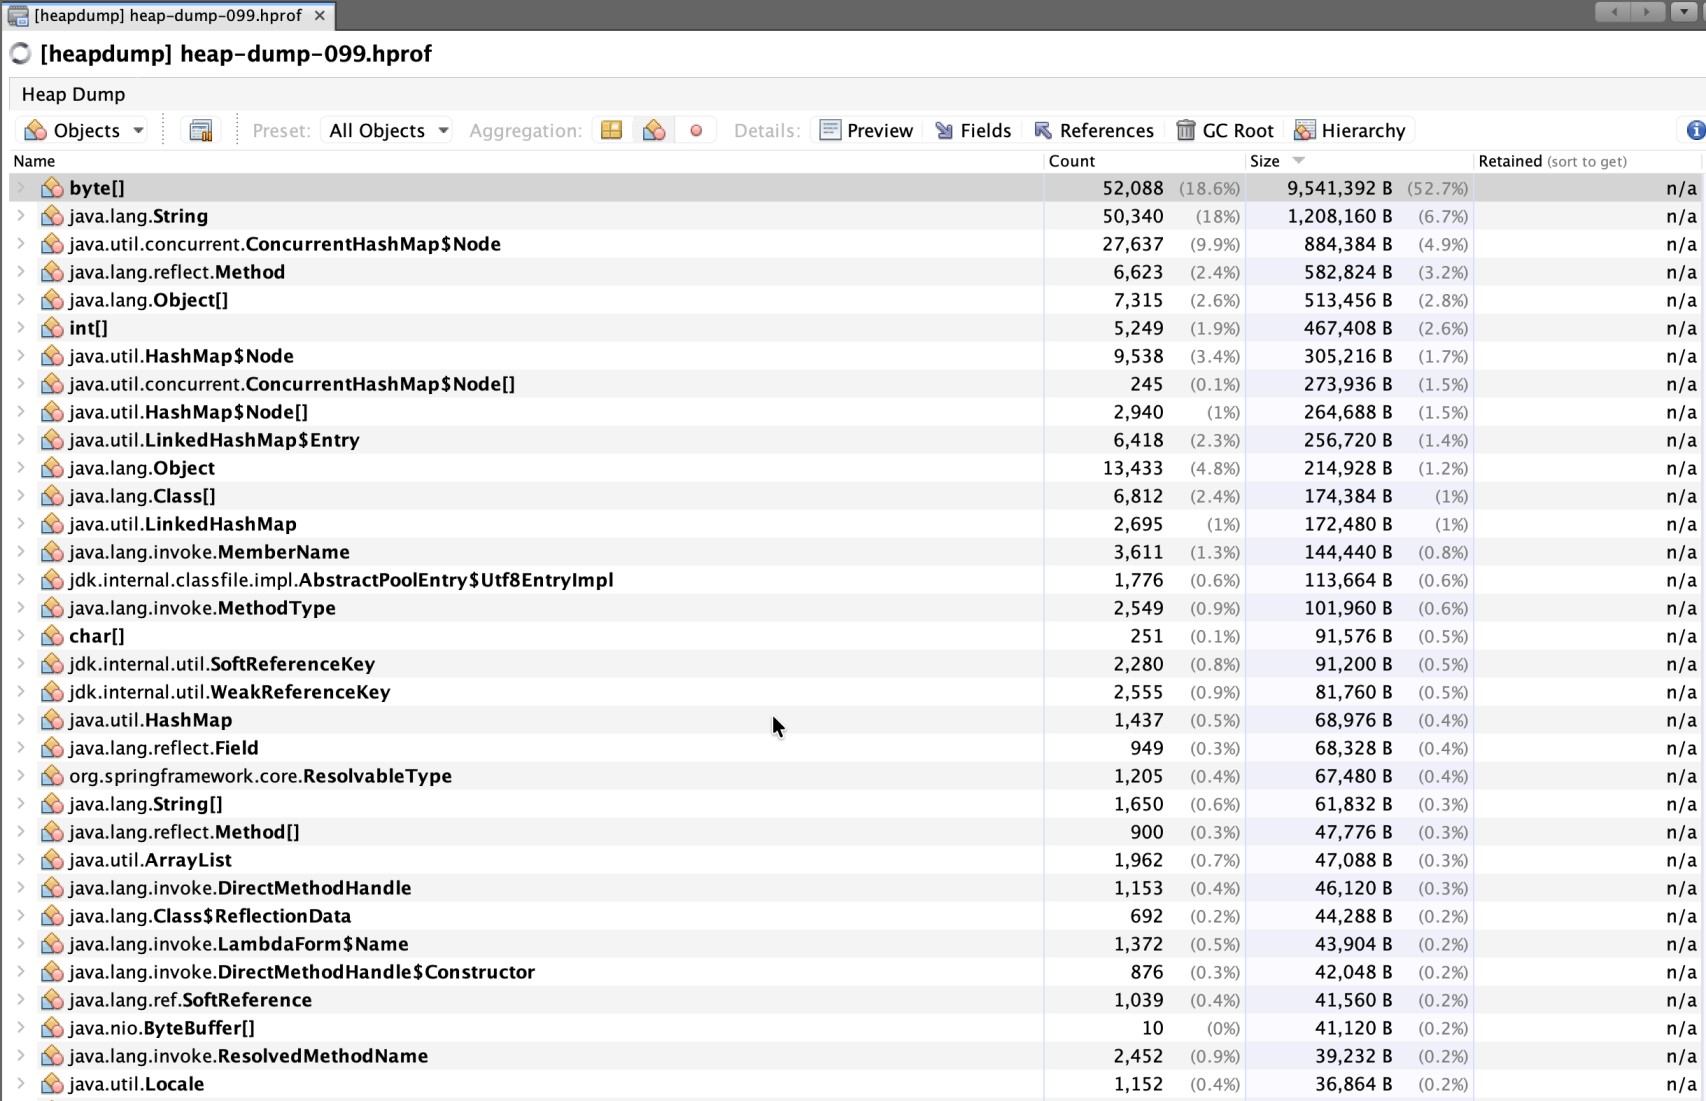
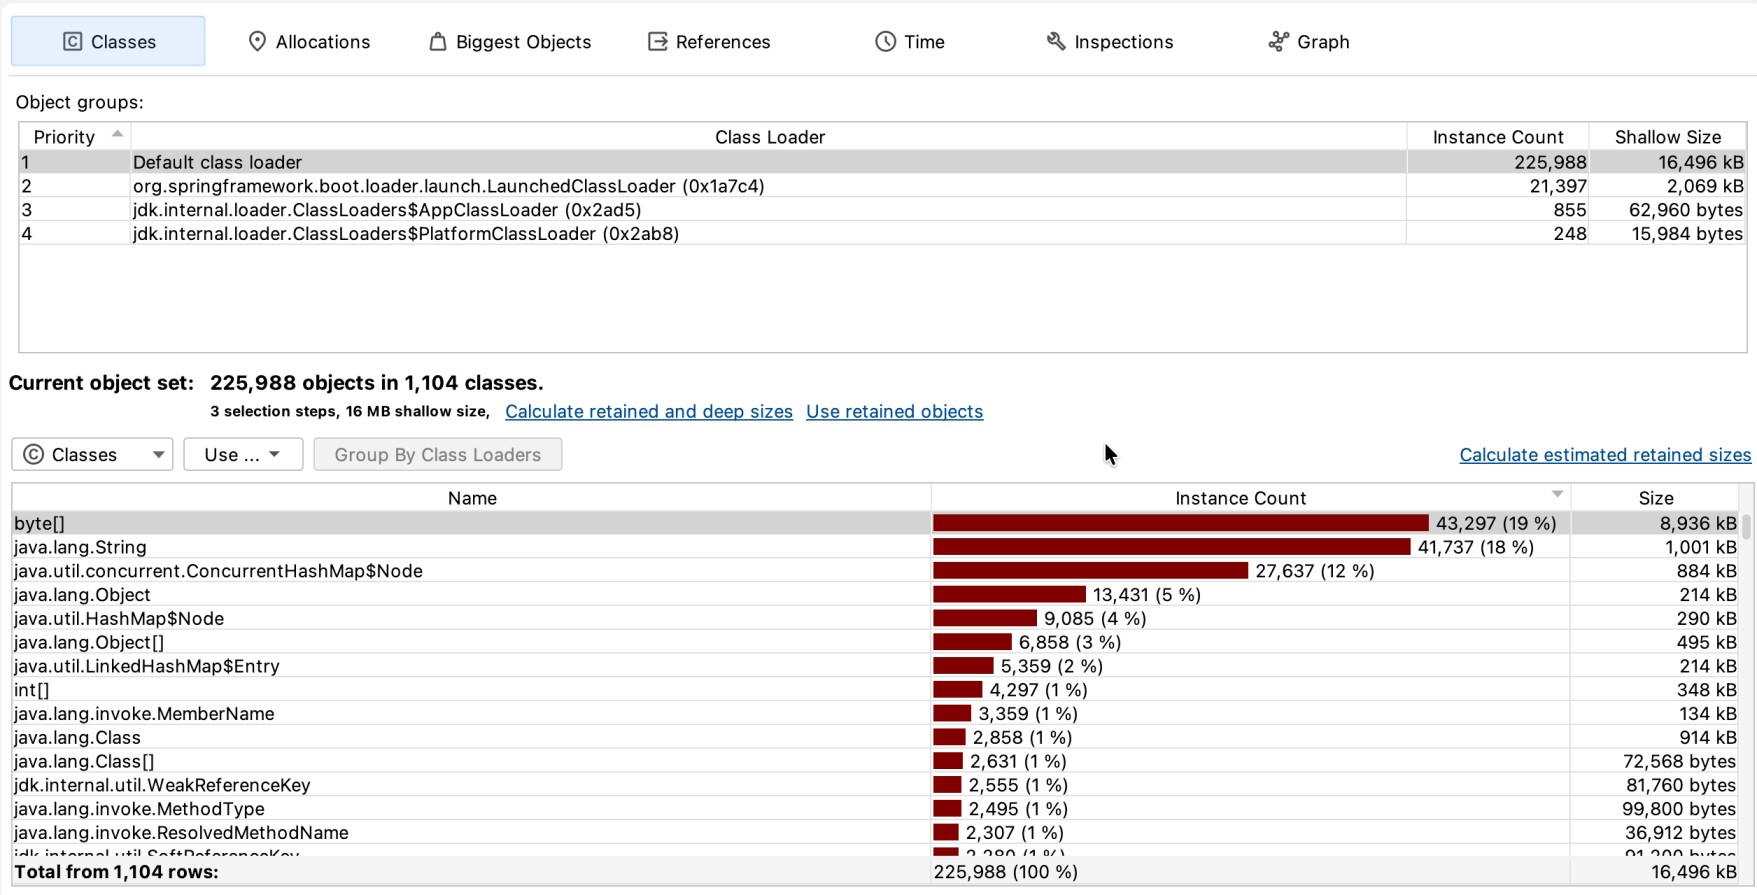
Because objects stored in the list remained reachable, the garbage collector could not reclaim them.
As more requests were processed, additional Order objects were added to the list, causing heap usage to grow continuously until the JVM eventually exhausted the available heap.
While the heap dump tells us what is occupying memory, it does not explain how the JVM behaved while the heap was filling up. For that, we need to examine the garbage collection logs.
Step 5. Analyse Garbage Collection Activity
Garbage collection logs show when collections occur, how much memory was reclaimed, how long each collection paused the application, and whether the heap continued to grow despite repeated garbage collection cycles.If GC logging is not already enabled, it can be configured using the following JVM option.
-Xlog:gc*:file=gc.log:time,uptime,level,tagsWhile the application is running, the log can be monitored in real time.
tail -f gc.log[2026-07-25T11:52:23.657+0000][0.006s][info][gc,init] CardTable entry size: 512
[2026-07-25T11:52:23.659+0000][0.008s][info][gc ] Using G1
[2026-07-25T11:52:23.675+0000][0.024s][info][gc,init] Version: 25.0.3+9-LTS (release)
[2026-07-25T11:52:23.675+0000][0.024s][info][gc,init] CPUs: 8 total, 8 available
[2026-07-25T11:52:23.675+0000][0.024s][info][gc,init] Memory: 512M
[2026-07-25T11:52:23.675+0000][0.024s][info][gc,init] Heap Region Size: 1M
[2026-07-25T11:52:23.675+0000][0.024s][info][gc,init] Heap Initial Capacity: 128M
[2026-07-25T11:52:23.675+0000][0.024s][info][gc,init] Heap Max Capacity: 256M
.
.
.
[2026-07-25T11:52:24.008+0000][0.357s][info][gc,start ] GC(0) Pause Young (Normal) (G1 Evacuation Pause)
[2026-07-25T11:52:24.013+0000][0.362s][info][gc,heap ] GC(0) Eden regions: 47->0(57)
[2026-07-25T11:52:24.013+0000][0.362s][info][gc,heap ] GC(0) Survivor regions: 0->3(6)
[2026-07-25T11:52:24.013+0000][0.362s][info][gc,heap ] GC(0) Old regions: 2->2
[2026-07-25T11:52:24.013+0000][0.363s][info][gc ] GC(0) Pause Young (Normal) (G1 Evacuation Pause) 48M->4M(130M) 5.112ms
.
.
.
[2026-07-25T11:52:24.170+0000][0.520s][info][gc,start ] GC(1) Pause Young (Normal) (G1 Evacuation Pause)
.
.
.
[2026-07-25T11:52:24.177+0000][0.526s][info][gc ] GC(1) Pause Young (Normal) (G1 Evacuation Pause) 61M->8M(130M) 6.488ms
.
.
.
[2026-07-25T11:52:24.311+0000][0.660s][info][gc,start ] GC(2) Pause Young (Concurrent Start) (Metadata GC Threshold)
.
.
.
[2026-07-25T11:52:24.317+0000][0.666s][info][gc ] GC(2) Pause Young (Concurrent Start) (Metadata GC Threshold) 42M->9M(130M) 5.539ms
[2026-07-25T11:52:24.317+0000][0.666s][info][gc ] GC(3) Concurrent Mark Cycle
.
.
.
[2026-07-25T11:52:24.322+0000][0.671s][info][gc ] GC(3) Pause Remark 10M->10M(128M) 1.273ms
.
.
.
[2026-07-25T11:52:24.323+0000][0.672s][info][gc ] GC(3) Pause Cleanup 10M->10M(128M) 0.013ms
.
.
.
[2026-07-25T11:52:24.324+0000][0.673s][info][gc ] GC(3) Concurrent Mark Cycle 7.173ms
The GC logs do not indicate excessive garbage collection or heap exhaustion. Therefore, the OutOfMemoryError is unlikely to be caused by inefficient garbage collection itself.
The JVM exposes useful garbage collection statistics through jstat.
app# jstat -gcutil 1 1000 S0 S1 E O M CCS YGC YGCT FGC FGCT CGC CGCT GCT
- 100.00 14.29 99.27 98.73 95.63 5 0.050 1 0.025 4 0.008 0.082
- 100.00 15.38 99.28 98.74 95.63 5 0.050 1 0.025 4 0.008 0.082
- 100.00 15.38 99.28 98.74 95.63 5 0.050 1 0.025 4 0.008 0.082
- 100.00 16.67 99.30 98.75 95.63 5 0.050 1 0.025 4 0.008 0.082
- 100.00 16.67 99.30 98.75 95.63 5 0.050 1 0.025 4 0.008 0.082
- 100.00 18.18 99.31 98.76 95.63 5 0.050 1 0.025 4 0.008 0.082
- 100.00 18.18 99.31 98.76 95.63 5 0.050 1 0.025 4 0.008 0.082
- 100.00 20.00 99.32 98.76 95.63 5 0.050 1 0.025 4 0.008 0.082
| Column | Value | Interpretation |
|---|---|---|
| S1 | 100.00% | Survivor Space 1 is completely full. |
| E | 66.67% | Eden Space is about two-thirds full. |
| O | 99.5% | Old Generation is essentially full. This is the biggest concern. |
| M | 98.55% | Metaspace is almost exhausted. |
| CCS | 95.63% | Compressed Class Space is also nearly full. |
| YGC | 5 | Five Young Garbage Collections have occurred. |
| FGC | 1 | One Full Garbage Collection has already occurred. |
| CGC | 4 | Four concurrent G1 GC cycles have run. |
| GCT | 0.082 sec | The JVM has spent only 82 milliseconds performing garbage collection. |
In contrast, an application experiencing a memory leak often shows a very different pattern.
Heap usage continues increasing after every garbage collection because objects remain reachable and cannot be reclaimed.
In this article, we assumed that the application was already known to be experiencing a memory problem because the logs contained a java.lang.OutOfMemoryError or the container had been terminated due to memory exhaustion.
The investigation therefore focused on identifying the root cause of the memory issue. In a real production environment, however, incidents doesn't begin with an OutOfMemoryError.
More commonly, a support ticket is raised because users are receiving 404, 500, or 503 responses, requests are timing out, or a particular business function has stopped working.
In a distributed microservices architecture, the first challenge is often determining which service is actually failing.
Only after narrowing the investigation to the affected service do you begin a deeper JVM-level analysis like the one covered in this article.
That initial production investigation typically involves examining application logs, distributed traces, metrics, dashboards, and service dependencies to identify the failing component.
Once you have determined that a Java service is experiencing memory exhaustion, the next step is to systematically investigate the root cause using the techniques discussed in this article.
Conclusion
When a Java application reports an OutOfMemoryError, resist the temptation to immediately increase -Xmx. The exception is often a symptom rather than the underlying cause.Start by verifying the container's memory limit. Next, inspect the JVM's heap configuration and confirm that it is correctly sized for the available container memory.
Compare heap usage with the overall process memory to understand how much memory is being consumed outside the Java heap.
Capture and analyse a heap dump to identify retained objects or memory leaks, and review the GC logs to understand how the JVM behaved as memory usage increased.