But when the pipeline fails, it rarely announces itself with elegance.
Records stop syncing. Search results become stale. Dashboards freeze in yesterday's truth. Business users lose confidence. Engineers begin investigating only after damage has already spread.
This is where an AI Agent becomes indispensable.
By combining Logstash monitoring with Google Gemini, one can build an intelligent system that continuously watches the pipeline, detects failures, interprets the likely cause, and raises incidents automatically.
This article presents a complete, practical, and production-ready guide to building such an agent.
Traditional monitoring tells you that something is wrong. An intelligent monitoring agent tells you:This transforms operations from reactive troubleshooting into proactive reliability.
- What failed
- Why it likely failed
- How severe it is
- What to do next
Objective
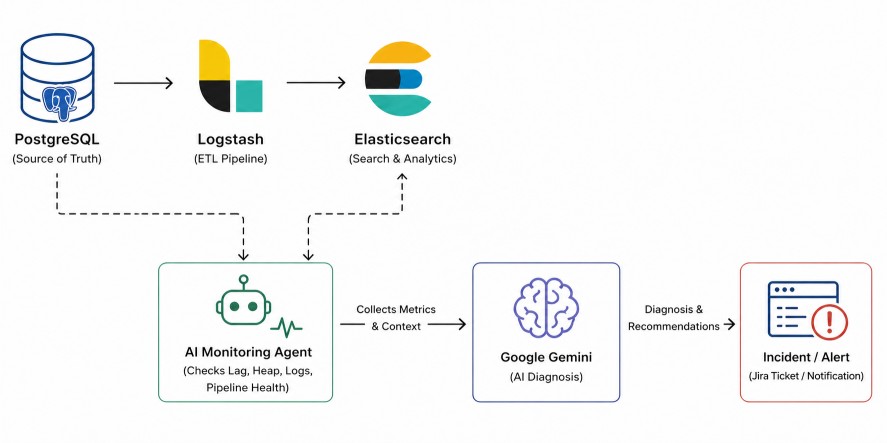
The system under observation is:PostgreSQL → Logstash → Elasticsearch- It checks PostgreSQL freshness.
- It checks Logstash runtime metrics.
- It verifies Elasticsearch indexing progress.
- It detects lag, stoppage, or errors.
- It sends evidence to Google Gemini.
- It receives diagnosis and remediation guidance.
- It triggers incidents or alerts.
Logstash exposes monitoring APIs such as node stats, pipeline metrics, JVM metrics, health reports, and process data, which make such automation practical.
Why Google Gemini?The full system looks like this:
Monitoring tools provide numbers. Google Gemini (LLM) provides understanding.
It enables secure access to foundation models through managed APIs, allowing the agent to convert metrics, logs, and symptoms into natural-language diagnosis.
PostgreSQL → Logstash → Elasticsearch
↓
Python AI Agent
↓
Google Gemini (LLM) Diagnosis
↓
Incident / Jira / Alert
Test Data Generation
To validate the monitoring agent end-to-end, create a working environment with a database source, Elasticsearch, and Logstash. Then generate sample data to simulate real pipeline traffic and failure scenarios.Step 1: Create Demo Table in PostgreSQL
Connect to PostgreSQL:createdb -h localhost -U postgres appdb
psql -h localhost -U postgres -d appdb
CREATE TABLE orders (
    id SERIAL PRIMARY KEY,
    customer_name VARCHAR(100),
    amount NUMERIC(10,2),
    status VARCHAR(30),
    updated_at TIMESTAMP DEFAULT CURRENT_TIMESTAMP
);
Step 2: Generate Sample Data Automatically
Create a file named seed.pyimport time
import random
import psycopg2
conn = psycopg2.connect(
host="localhost",
dbname="appdb",
user="postgres",
password="secret"
)
cur = conn.cursor()
names = ["Alice", "Bob", "Charlie", "David", "Emma"]
statuses = ["NEW", "PAID", "SHIPPED"]
while True:
cur.execute(
"""
INSERT INTO orders(customer_name, amount, status)
VALUES(%s,%s,%s)
""",
(
random.choice(names),
round(random.uniform(10, 500), 2),
random.choice(statuses)
)
)
conn.commit()
print("Inserted row")
time.sleep(5)
python seed.pyRun Elasticsearch and Logstash
This setup runs both Elasticsearch and Logstash using Docker Compose. Below is the complete project structure, required files, and execution steps.Project Structure
elk-project/
│── docker-compose.yml
│── logstash/
│   └── pipeline/
│       └── logstash.conf
Step 1: Create docker-compose.yml
services:
  elasticsearch:
    image: docker.elastic.co/elasticsearch/elasticsearch:9.3.3
    container_name: elasticsearch
    environment:
      - discovery.type=single-node
      - xpack.security.enabled=false
      - ES_JAVA_OPTS=-Xms1g -Xmx1g
    ports:
      - "9200:9200"
      - "9300:9300"
    volumes:
      - es_data:/usr/share/elasticsearch/data
    networks:
      - elk

  logstash:
    image: docker.elastic.co/logstash/logstash:9.3.3
    container_name: logstash
    depends_on:
      - elasticsearch
    ports:
      - "5044:5044"
      - "9600:9600"
    volumes:
      - ./logstash/pipeline:/usr/share/logstash/pipeline
    environment:
      - LS_JAVA_OPTS=-Xms512m -Xmx512m
    networks:
      - elk

volumes:
  es_data:

networks:
  elk:
    driver: bridge
{
  "name" : "25f002ee6470",
  "cluster_name" : "docker-cluster",
  "cluster_uuid" : "gho8odYbQVqULXgFFj0ajw",
  "version" : {
    "number" : "9.3.3",
    "build_flavor" : "default",
    "build_type" : "docker",
    "build_hash" : "640408e2dfd2af9fbfe5079e1575f93d8909a5f5",
    "build_date" : "2026-04-01T22:08:18.783399214Z",
    "build_snapshot" : false,
    "lucene_version" : "10.3.2",
    "minimum_wire_compatibility_version" : "8.19.0",
    "minimum_index_compatibility_version" : "8.0.0"
  },
  "tagline" : "You Know, for Search"
}
Step 2: Create Logstash Pipeline
Create file:logstash/pipeline/logstash.confinput {
jdbc {
jdbc_driver_library => "/path/postgresql-42.7.3.jar"
jdbc_driver_class => "org.postgresql.Driver"
jdbc_connection_string => "jdbc:postgresql://localhost:5432/appdb"
jdbc_user => "postgres"
jdbc_password => "secret"
statement => "SELECT * FROM orders WHERE updated_at > :sql_last_value"
use_column_value => false
tracking_column => "updated_at"
schedule => "*/1 * * * *"
last_run_metadata_path => "./last_run.yml"
}
}
filter {
}
output {
elasticsearch {
hosts => ["http://localhost:9200"]
index => "orders_index"
document_id => "%{id}"
}
stdout { codec => rubydebug }
}
cd elk-project

curl -L -O https://artifacts.elastic.co/downloads/logstash/logstash-9.3.3-darwin-x86_64.tar.gz
tar zxf logstash-9.3.3-darwin-x86_64.tar.gz

logstash-9.3.3/bin/logstash -f logstash/pipeline/logstash.conf


[2026-04-27T17:32:46,025][INFO ][logstash.javapipeline    ][main] Pipeline started {"pipeline.id"=>"main"}
[2026-04-27T17:32:46,084][INFO ][logstash.agent           ] Pipelines running {:count=>1, :running_pipelines=>[:main], :non_running_pipelines=>[]}
% curl "http://localhost:9200/_cat/indices?v"

health status index        uuid                   pri rep docs.count docs.deleted store.size pri.store.size dataset.size
yellow open   orders_index SdfrMcTtSFaNNnjbcz0Q4A   1   1        285            0     90.6kb         90.6kb       90.6kb
% curl -X GET "localhost:9200/orders_index/_search?pretty" \
-H "Content-Type: application/json" \
-d'
{
  "size": 1
}'
{
  "took" : 9,
  "timed_out" : false,
  "_shards" : {
    "total" : 1,
    "successful" : 1,
    "skipped" : 0,
    "failed" : 0
  },
  "hits" : {
    "total" : {
      "value" : 297,
      "relation" : "eq"
    },
    "max_score" : 1.0,
    "hits" : [
      {
        "_index" : "orders_index",
        "_id" : "2",
        "_score" : 1.0,
        "_source" : {
          "@version" : "1",
          "id" : 2,
          "status" : "NEW",
          "customer_name" : "David",
          "@timestamp" : "2026-04-27T12:04:00.730582Z",
          "amount" : 478.5,
          "updated_at" : "2026-04-27T11:39:18.791595Z"
        }
      }
    ]
  }
}
Start the Agent
Step 1: Install Dependencies
Create the project folder.mkdir pipeline-ai-agent
cd pipeline-ai-agent
pip install requests psycopg2-binary elasticsearch schedule python-dotenv
Requests: Popular library for making HTTP requests to APIs and websites.
psycopg2 (psycopg2-binary): Connects Python to PostgreSQL databases.
Elasticsearch Python Client: Lets Python communicate with Elasticsearch.
schedule: Run tasks automatically at intervals (every minute, hour, day, etc.).
python-dotenv: Loads variables from a .env file (API keys, passwords, config values).
Step 3: Complete Working Python Agent
Create a file named agent.pyimport os
import time
from datetime import datetime, timezone
import psycopg2
import requests
import schedule
from dotenv import load_dotenv
from elasticsearch import Elasticsearch
load_dotenv()
# =====================================================
# ENV VARIABLES
# =====================================================
PG_HOST = os.getenv("PG_HOST")
PG_PORT = os.getenv("PG_PORT")
PG_DB = os.getenv("PG_DB")
PG_USER = os.getenv("PG_USER")
PG_PASSWORD = os.getenv("PG_PASSWORD")
ES_URL = os.getenv("ES_URL")
ES_INDEX = os.getenv("ES_INDEX")
LOGSTASH_URL = os.getenv("LOGSTASH_URL")
GEMINI_API_KEY = os.getenv("GEMINI_API_KEY")
JIRA_URL = os.getenv("JIRA_URL")
JIRA_EMAIL = os.getenv("JIRA_EMAIL")
JIRA_API_TOKEN = os.getenv("JIRA_API_TOKEN")
JIRA_PROJECT = os.getenv("JIRA_PROJECT")
# =====================================================
# GLOBALS
# =====================================================
es = Elasticsearch(ES_URL)
incident_open = False
incident_ticket_key = None
# =====================================================
# DATABASE CHECK
# =====================================================
def get_postgres_latest():
conn = psycopg2.connect(
host=PG_HOST,
port=PG_PORT,
dbname=PG_DB,
user=PG_USER,
password=PG_PASSWORD
)
cur = conn.cursor()
cur.execute("SELECT MAX(updated_at) FROM orders;")
row = cur.fetchone()[0]
cur.close()
conn.close()
return row
# =====================================================
# ELASTICSEARCH CHECK
# =====================================================
def get_elasticsearch_latest():
result = es.search(
index=ES_INDEX,
body={
"size": 1,
"sort": [
{"updated_at": {"order": "desc"}}
]
}
)
hits = result["hits"]["hits"]
if not hits:
return None
ts = hits[0]["_source"]["updated_at"]
return datetime.fromisoformat(
ts.replace("Z", "+00:00")
)
# =====================================================
# LOGSTASH CHECK
# =====================================================
def get_logstash_stats():
try:
url = f"{LOGSTASH_URL}/_node/stats"
r = requests.get(url, timeout=5)
r.raise_for_status()
return r.json()
except:
return None
# =====================================================
# GEMINI AI ANALYSIS
# =====================================================
def ask_gemini(context):
prompt = f"""
You are a senior data platform engineer.
Analyze this Logstash pipeline issue.
Context:
{context}
Return clearly:
1. Root Cause
2. Severity
3. Recommended Fix
4. Preventive Advice
"""
url = (
"https://generativelanguage.googleapis.com/v1beta/models/"
"gemini-2.5-flash:generateContent"
f"?key={GEMINI_API_KEY}"
)
body = {
"contents": [
{
"parts": [
{"text": prompt}
]
}
]
}
response = requests.post(
url,
json=body,
timeout=30
)
response.raise_for_status()
data = response.json()
if "candidates" in data:
return data["candidates"][0]["content"]["parts"][0]["text"]
return str(data)
# =====================================================
# JIRA CREATE TICKET
# =====================================================
def create_jira_ticket(summary, description_text):
url = f"{JIRA_URL}/rest/api/3/issue"
payload = {
"fields": {
"project": {"key": JIRA_PROJECT},
"summary": summary,
"issuetype": {"name": "Task"},
"description": {
"type": "doc",
"version": 1,
"content": [
{
"type": "paragraph",
"content": [
{
"type": "text",
"text": description_text[:3000]
}
]
}
]
}
}
}
response = requests.post(
url,
auth=(JIRA_EMAIL, JIRA_API_TOKEN),
headers={
"Accept": "application/json",
"Content-Type": "application/json"
},
json=payload
)
print(response.status_code)
print(response.text)
response.raise_for_status()
return response.json()
# =====================================================
# MAIN MONITOR
# =====================================================
def monitor():
global incident_open
global incident_ticket_key
try:
pg_latest = get_postgres_latest()
es_latest = get_elasticsearch_latest()
stats = get_logstash_stats()
if pg_latest is None:
print("No PostgreSQL records found.")
return
if pg_latest.tzinfo is None:
pg_latest = pg_latest.replace(
tzinfo=timezone.utc
)
if es_latest is None:
lag = 999999
else:
lag = (pg_latest - es_latest).total_seconds()
if stats is None:
heap = 999
logstash_down = True
else:
heap = stats["jvm"]["mem"]["heap_used_percent"]
logstash_down = False
print("------ HEALTH CHECK ------")
print("Postgres :", pg_latest)
print("Elastic :", es_latest)
print("Heap % :", heap)
print("Lag Sec :", round(lag, 2))
print("Logstash :", "DOWN" if logstash_down else "UP")
# =====================================
# INCIDENT DETECTED
# =====================================
if lag > 300 or heap > 90 or logstash_down:
context = f"""
PostgreSQL latest record: {pg_latest}
Elasticsearch latest record: {es_latest}
Pipeline lag seconds: {lag}
JVM heap used: {heap}%
Logstash status: {"DOWN" if logstash_down else "UP"}
"""
diagnosis = ask_gemini(context)
print("\n=== INCIDENT DETECTED ===")
print(diagnosis)
# create ticket only once
if not incident_open:
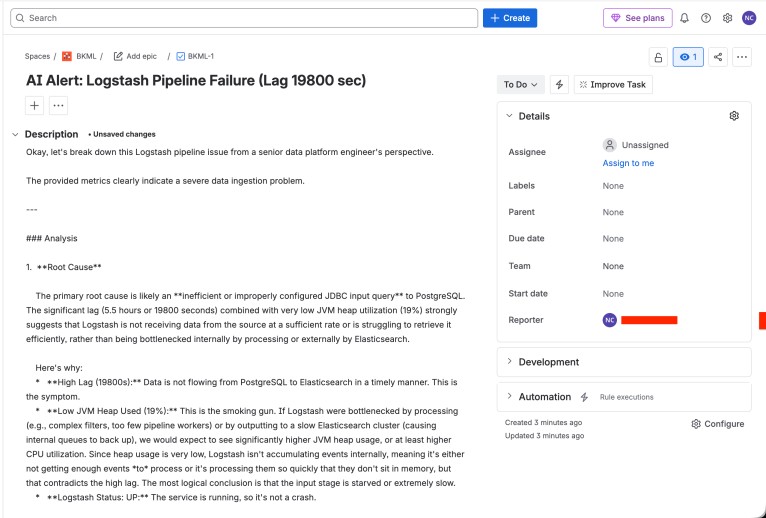
summary = f"AI Alert: Logstash Pipeline Failure (Lag {int(lag)} sec)"
ticket = create_jira_ticket(
summary,
diagnosis
)
incident_ticket_key = ticket["key"]
incident_open = True
print(f"\nJira Ticket Created: {incident_ticket_key}")
else:
print(
f"\nIncident already open: {incident_ticket_key}"
)
# =====================================
# RECOVERED
# =====================================
else:
print("Pipeline healthy.\n")
if incident_open:
print(
f"Pipeline recovered. Previous incident: {incident_ticket_key}"
)
incident_open = False
incident_ticket_key = None
except Exception as e:
print("Monitoring error:", str(e))
# =====================================================
# SCHEDULER
# =====================================================
schedule.every(1).minutes.do(monitor)
print("AI Agent Started")
monitor()
while True:
schedule.run_pending()
time.sleep(2)
Step 4: Run the Agent
Execute:python3 agent.pyAI Agent Started
------ HEALTH CHECK ------
Postgres : 2026-04-27 18:13:21.659520+00:00
Elastic : 2026-04-27 12:43:21.659520+00:00
Heap % : 19
Lag Sec : 19800.0
Logstash : UP
=== INCIDENT DETECTED ===
.
.
.
{"id":"10008","key":"BKML-1","self":"https://backendml.atlassian.net/rest/api/3/issue/10008"}
Jira Ticket Created: BKML-1
The image below shows the actual Jira ticket created by the AI monitoring agent in real time.
Conclusion
This project demonstrates how modern AI can transform pipeline operations by continuously monitoring a PostgreSQL → Logstash → Elasticsearch data flow, detecting failures in real time, analyzing probable root causes with Gemini, and automatically creating incidents in Jira.The final solution goes beyond traditional alerting. It correlates pipeline lag, JVM memory pressure, Logstash availability, and indexing freshness into meaningful operational insight.
In practice, such an agent reduces downtime, shortens incident response time, improves engineering confidence, and creates a repeatable framework for intelligent observability.